jackievannice.com
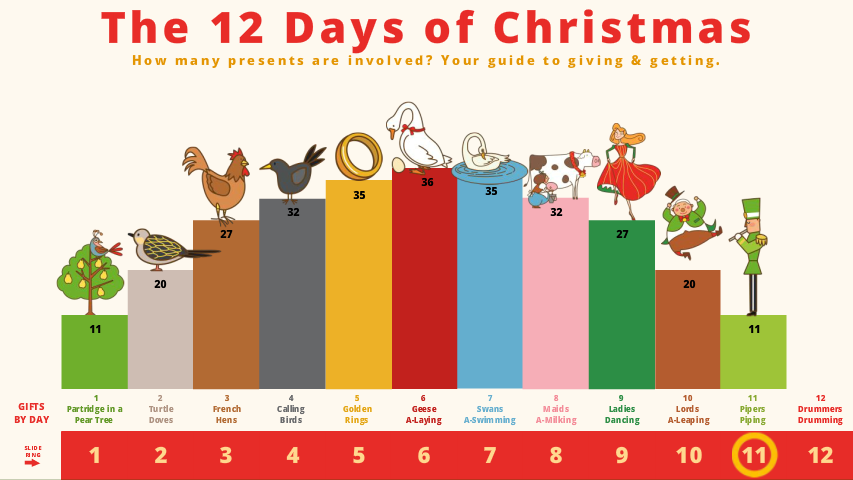
The 12 Days of Data Presentation
This week’s challenge is to present data using interactive charts and graphs, so I decided to chart a popular Christmas carol.